- You want to compare proportions across categories
- You’re visualizing hierarchical data
- Space is limited and you want a compact alternative to bar or pie charts
Layout
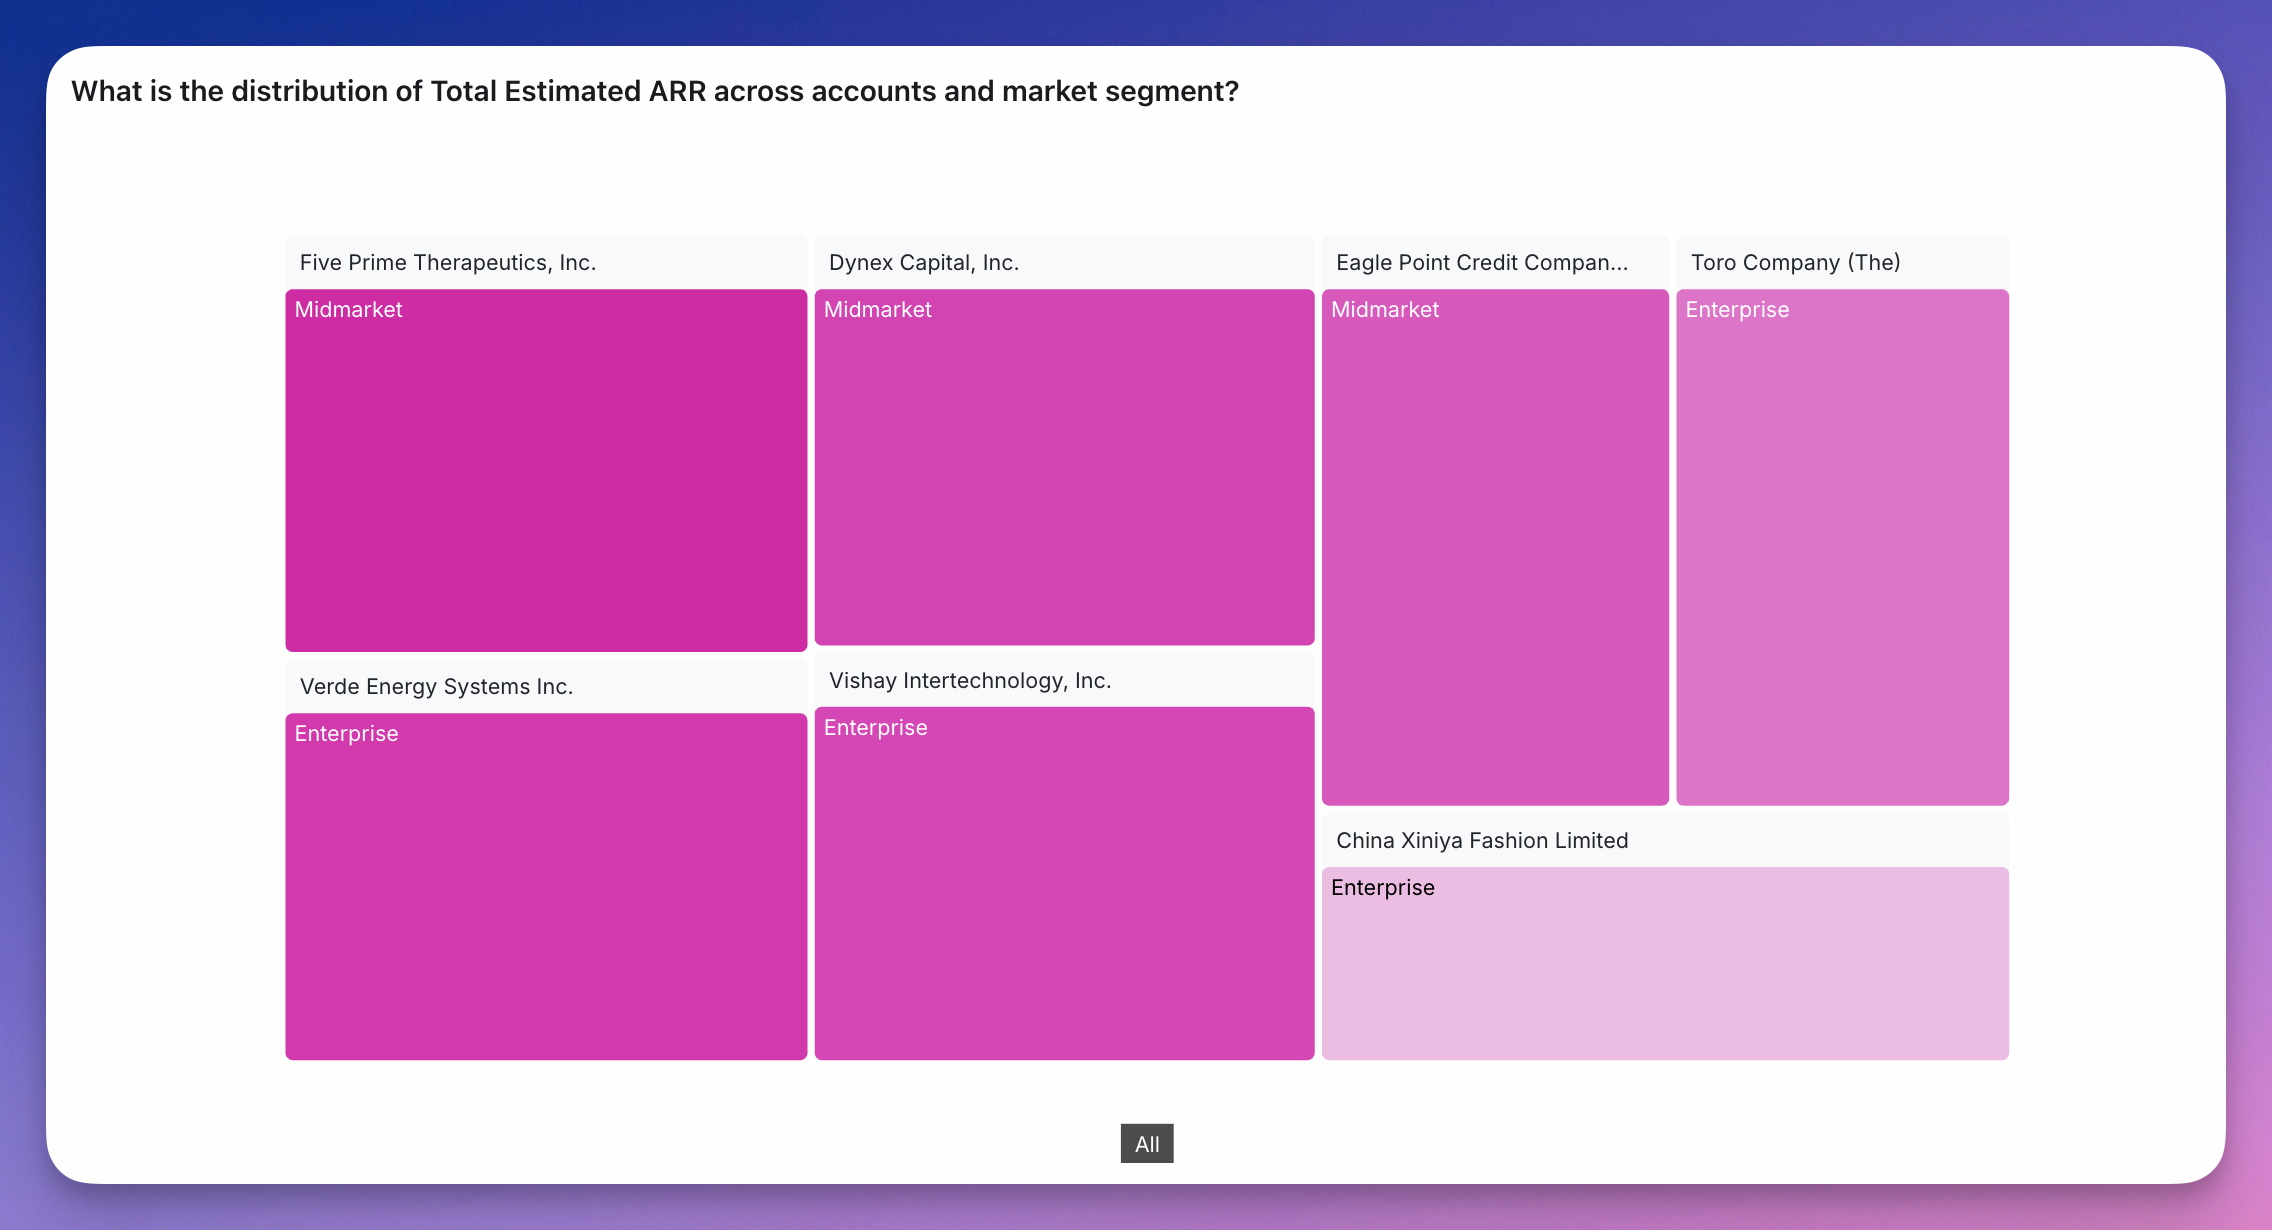
- Dimension hierarchy tells Lightdash how to group or nest the dimensions.
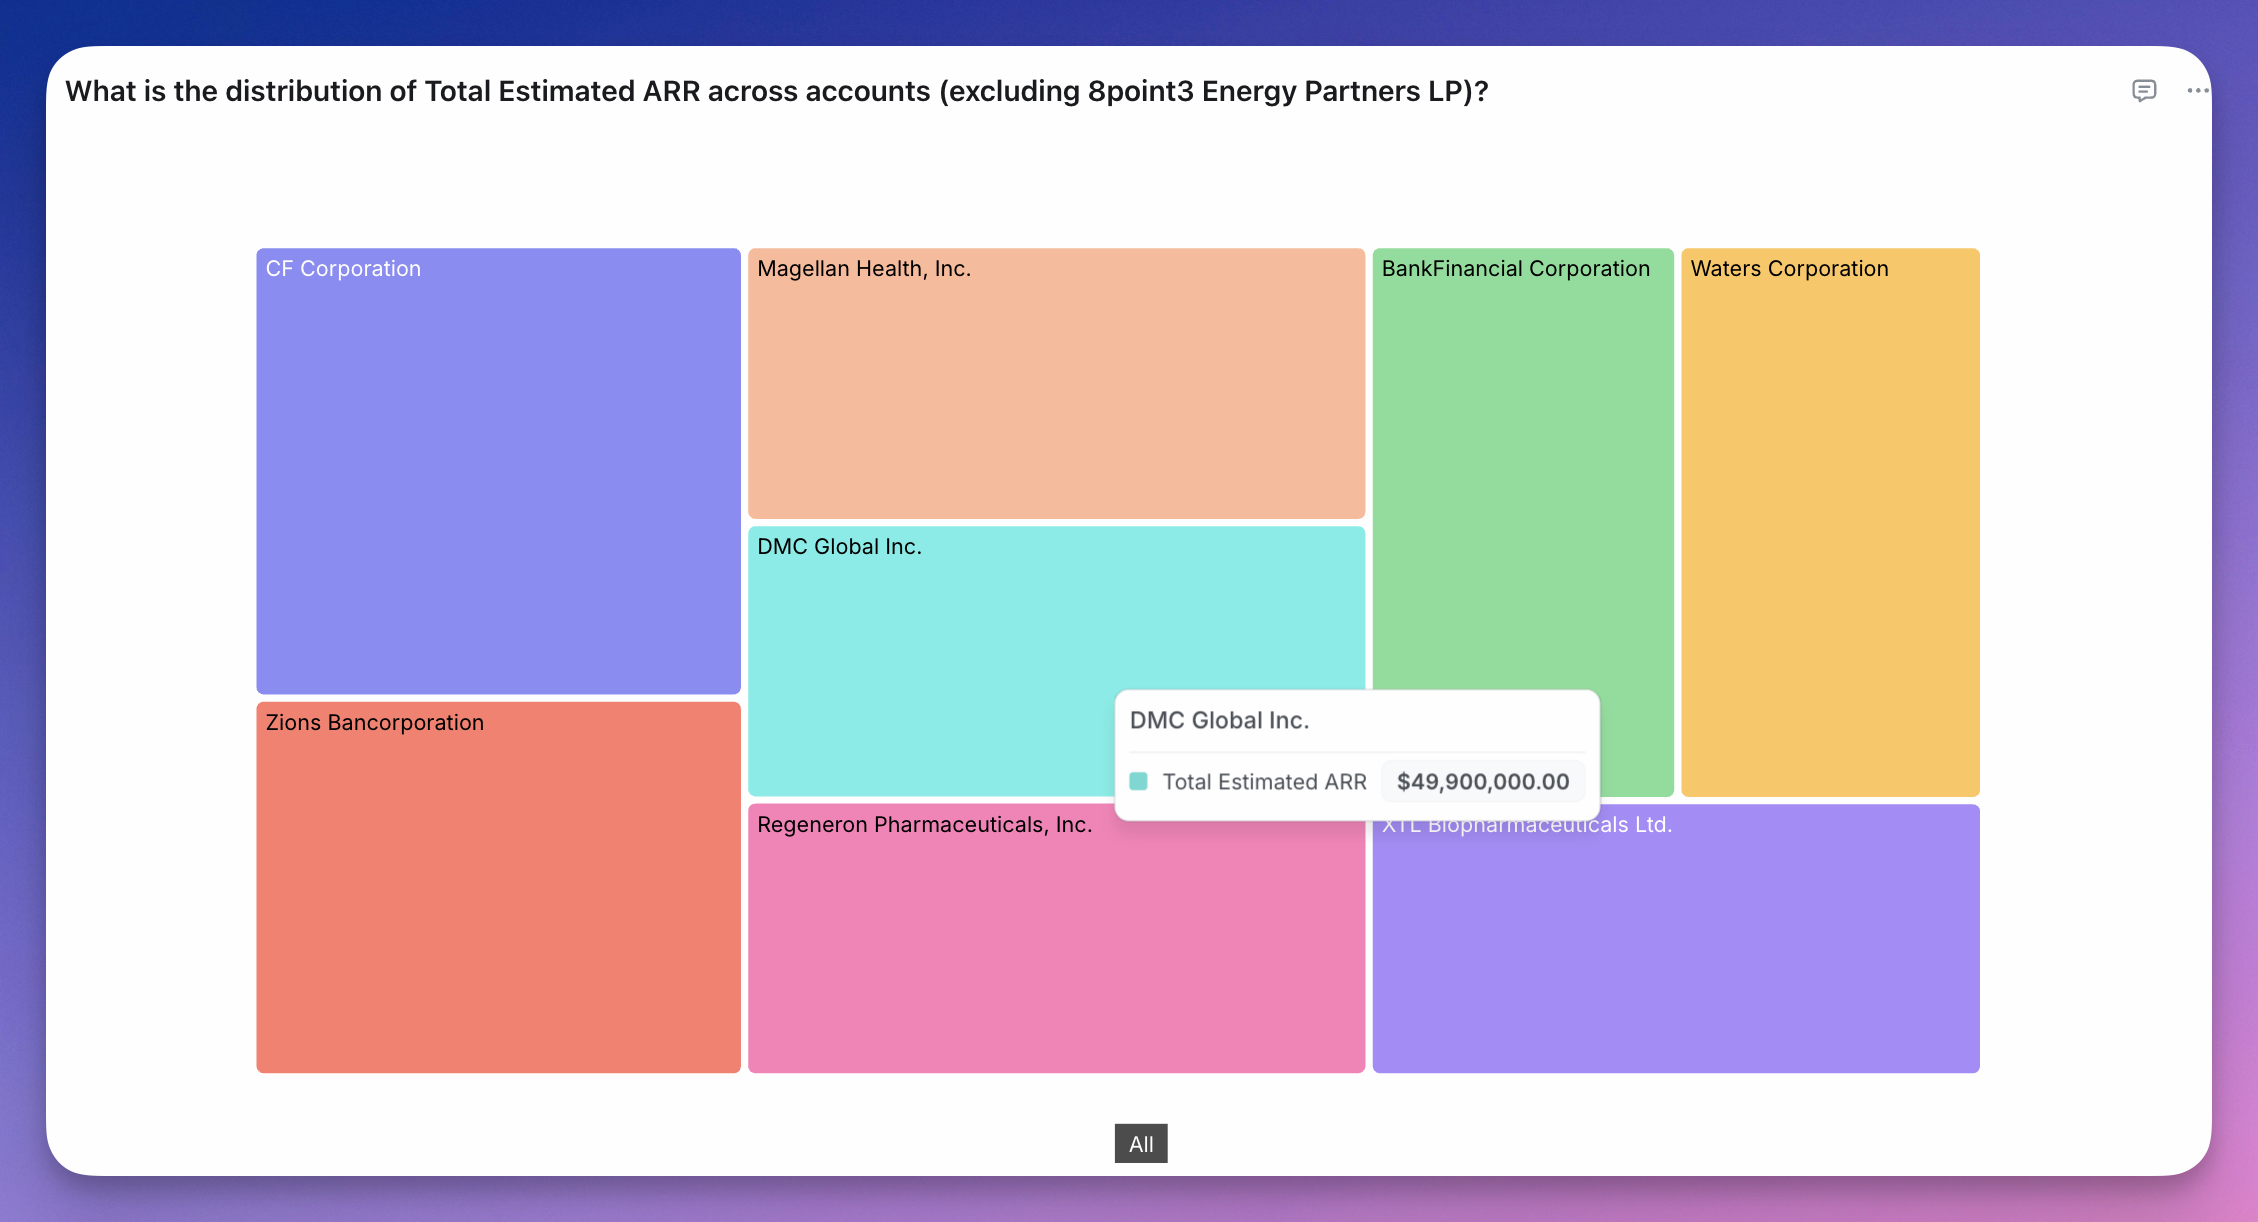
- Size metric determines how large each section of the treemap chart is.
- Color metric allows you to set a color scale for Highlighting each section of the treemap.
Display
- Minimum section size determines when to start hiding sections, anything smaller than this size can be shown by zooming in.
- Max leaf depth allows you to choose when a user needs to start drilling into sections to see the next tier, default value is 2.