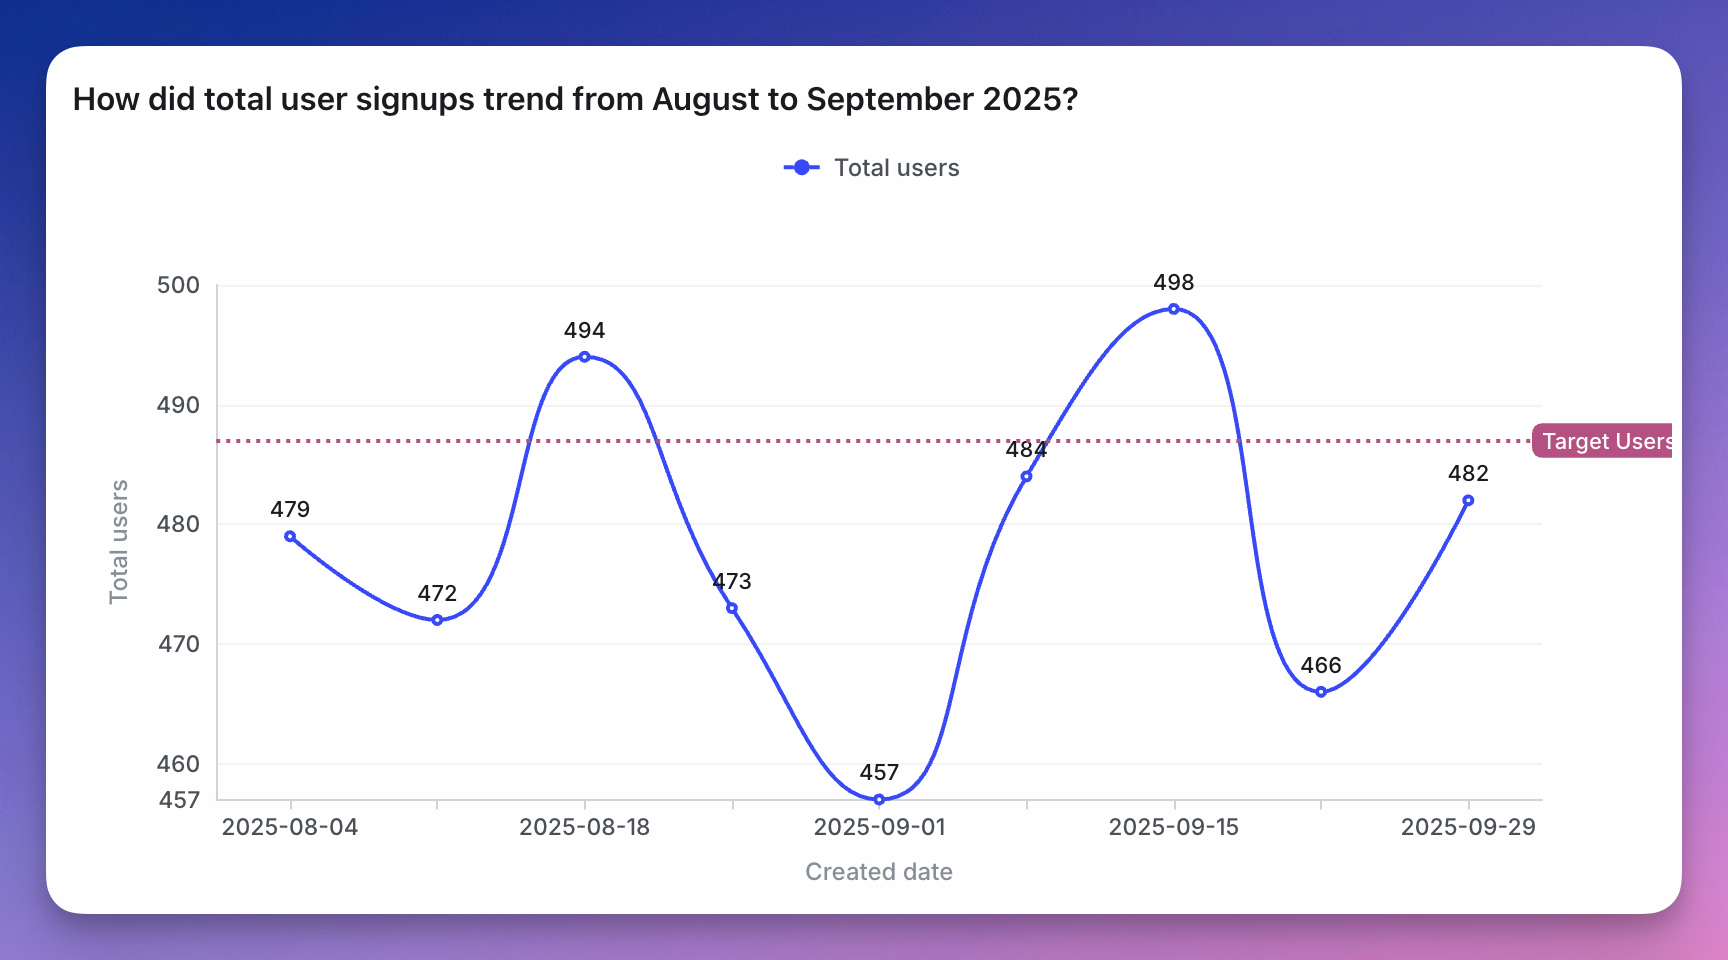
- you have small changes between your values. The y-axis of a line chart doesn’t need to start at zero. This means that your y-axis can be stretched to show the tiny differences.
- you have lots of x-axis values. In this case, line charts are better to use than bar charts.